FAKE NEWS ALERT!
Unbeknownst to us, it turns out that we’ve been publishing fake news in this update every month. For that, we are sorry – interestingly, I’m not actually sure that there’s a better way to produce the information.
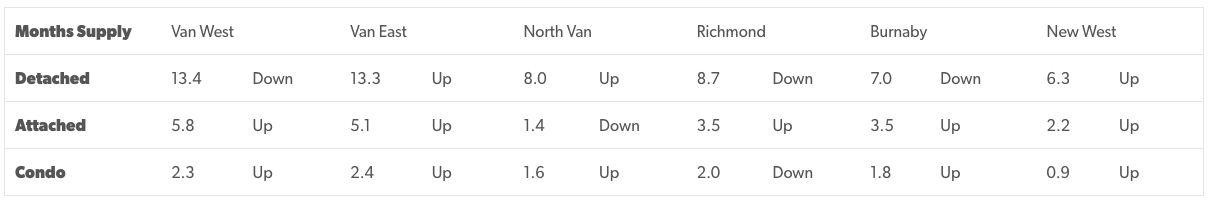
More on that in a second – let’s first start with the usual stats. The numbers shown are a ratio of the number of active listings (at end of month) over the number of sales in that month. Numbers above a 7 are considered to be buyers’ markets, below a 5 are sellers’ and in-between are considered balanced. Beside the number, I’ve indicated the direction the market moved when compared to the previous month.
HOW?
The story as to how we’ve been publishing fake news is an interesting one. Every month on the second business day of the month, the Real Estate Board of Greater Vancouver publishes a stats report to all members (and distributes the report to media outlets too). A portion of the data we use to compile this report (specifically, the # of sales for the month) is found in that report. For those of you who want further detail, we then go and find the total inventory numbers from an altogether different report that does not seem to get published anywhere and get our market dynamics indicators from those two numbers together. Here’s where things get interesting….The Real estate board published this months report on Friday. In that report, the Board indicated that there were 46 Detached homes sold on the Westside of Vancouver, 45 on the Eastside, 92 Attached homes sold on the Eastside of Vancouver and 147 Attached homes sold in Burnaby. In preparing this month’s report, I was using the back end access to MLS and noticed that the numbers of sales in the system that I can see simply don’t match that. According to the access I have 41 Detached homes sold on the Westside of Vancouver, 35 on the Eastside, 86 Attached homes sold on the Eastside of Vancouver and 149 Attached homes sold in Burnaby. Seeing the discrepancy, I thought I’d do a bit more digging and pulled out the January 2017 numbers. The report at that time indicated 36 Detached homes sold on the Westside of Vancouver, 51 on the Eastside, 87 Attached homes sold on the East side of Vancouver and 135 Attached homes sold in Burnaby. Using the back end system, those same numbers looked like 58 Detached homes sold on the Westside of Vancouver, 74 on the Eastside, 132 Attached homes sold on the Eastside of Vancouver and 171 Attached homes sold in Burnaby. As you can see, all of those numbers were also wrong (and, I would point out, by a far larger percentage).
WHY?
So, we literally just discovered this error in the data today. As such, we have some theories as to what’s causing the data errors. At least partially, some of the data errors are a result of deals that were agreed upon in January not becoming firm (due to subjects) for some period of time after (long after the report would be published even). On some level, we have to accept that the only solution to that is to take the stats at the same “time” every month and hope that the percentage of deals that are out there, but not firm remains reasonably constant (and I would suggest that that’s not a great assumption, but is probably a necessary one). Similarly, a firm deal done too close to the end of the month might not get reported to the board (who ultimately is the only one who can process a sales report into the MLS system) for as much as 5 days after the deal is done, thereby missing the data cutoff as well. However, it is clear that the discrepancy in the numbers goes beyond that as well.
WHAT’S NEXT?
We’re going to investigate this as much as we can and hope to put some sense to all of this. We’d dearly love to know how else the numbers published on Friday are higher than what the back end of MLS would appear to tell us is true. At the same time, we’re going to ensure that we’re continuing to use the same data sources we always have so that, at the very least, the errors remain the same month over month.The lesson here is that, while we do our very best to make sure the information we share with you is accurate, stats of any kind can only ever give us a partial picture of the whole. If you ever want help interpreting the picture, we are always happy to help.